Activité 1
- Listen and follow the story C’est graphique
https://schmedia.pearsoncanada.ca/mlb/index.html?code=1D2-FR
- When you are finished reading, complete the activity. Don’t forget to save 🙂
Here are the instructions in English:
In a survey on animals, we see 4 cats and 8 dogs.
Show 4 cats and 8 dogs on the graph.
Which animal is the post popular?
Explain how you know this just by looking at the graph.
Activité 2
Option 1
Create your own graph by comparing at least 2 items you can find in your household. You can use the graph that I provided or you can create one of your own
Ex. Are there more windows or doors in the house?
Ex 2. Do you have more books in English or in French?
Option 2
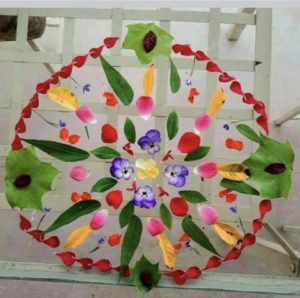
1.Create your own Mandala design with objects from in or outside your home. Mandala comes from the ancient Indian language Sanskrit, and means a circular form. The Mandala is important in many cultures around the world and can take on different meanings depending on the culture. Can you find examples of Mandalas in your home or in nature?
2.After you have created your Mandala. Graph the items that you used to make your Mandala, and compare. How many of each item did you use? What was the most popular item? What was the least popular item? You can use the graphing template that I provided or you can create a graph of your own.


Activité 3
1.Please complete the following activity. Find and count the images. Write the quantity of each item in the appropriate box. On the next page, please graph the items and answer the questions.
FrenchISpyPrintablesChercheettrouve (dragged)
FrenchISpyPrintablesChercheettrouve (dragged) 2
Activité 4
Come up with 2 “sondage”/survey questions that you could ask your classmates.
Par example: Comment allez vous à l’école? À pied? En autobus? En voiture? À vélo?