We have been working on graphing in math and have so far learned about bar graphs and pictographs. We’ve also been able to learn a lot more about each other through graphing!
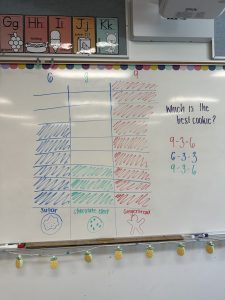
Here’s a bar graph we did as a class about what the best cookie is – we only had three options but I know there are WAY more yummy choices!
We also looked at our data and compared our results using subtraction equations.