Option #1:
What can we learn about the science behind profanity (shocking words?_
“One thing we know from pain experiments—where subjects put their hands into nearly-freezing water to see how long they can hold it there—is that people do better when they are told to swear. However, people who report swearing more in their normal lives show less pain alleviation when they swear with their hand in cold water. So swearing does less for people who swear more.”
Research Questions:
Can cats be left-paw or right-paw dominant?
What do the results indicate about their brains?
Most humans have a preferred hand (and foot, eye and ear), meaning that one of the pair responds more frequently than the other to stimuli. Human brains map into two hemispheres that have specialized functions with “crossed” connections. The left hand is controlled by the right hemisphere’s cortex region and vice versa.
The constants in this experiment are the cats, the environment and the tester. The cats will respond to various—tempting—articles in their vicinity, and the frequency with which they use each paw is recorded. Across activities, a general conclusion can be reached about paw preference and perhaps the similarity of a cat’s brain to that of a human.
Materials:
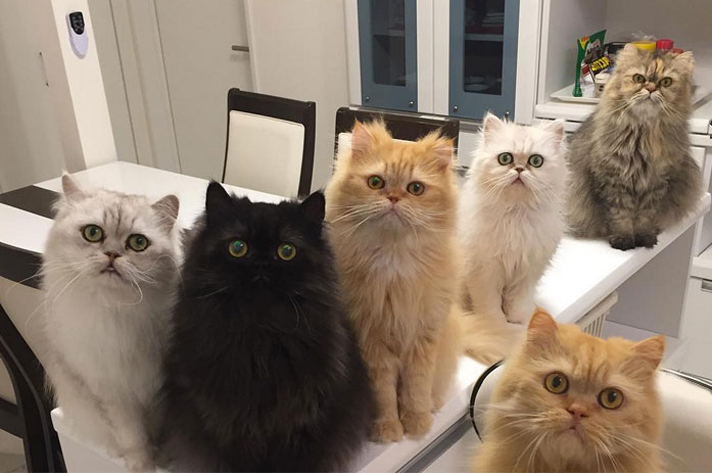
Group of cats.
Cat treats.
Feathers.
String.
Logbook.
Experimental Procedure
Record the gender and age for each cat.
Place a treat beneath a piece of furniture or piece of paper near the cat.
Observe which paw the cat uses to reach for the treat.
Take a short break and repeat. Do this again for a total of three times per cat.
When the cat is lying quietly, gently twist a feather approximately 12 inches from its upper body and lay the feather down.
Observe which paw the cat uses to reach for the feather.
Take a short break and repeat as above.
Likewise, with similarly reclining cat, wiggle a six-inch piece of string in front of the cat.
Observe which paw the cat uses to try and trap the string.
With nine results for each cat, calculate a percentage for the two paws and make conclusions about paw preference.
A table can record the results:
Test
Cat 1
F, 3 yrs
Cat 2
M, 5 yrs
Cat 3
M, 2 yrs
Cat 4
F, 8 yrs
Treat 1
Treat 2
Treat 3
Feather 1
Pie charts can display the percentages visually:


