Hello Division 7!
Shape of the day:
- To-do list
- Read through blog
- Learning opportunities:
- Morning journal
- Survey
- Khan Academy
- Reading
- Service
- Body Break
- Social Break
We are on day 3 of our virtual learning journey together. I don’t know about you, but these three days felt very full and fast. It feels like it could be May already. Maybe it’s because of this beautiful weather we are experiencing! Have you been going outside much? What seems challenging during this time is keeping on top of the new expectations. I find myself asking Google a lot of questions: Should I wear my mask out? Is it safe to order take-out? Is it okay to go for a bike ride? Can I use my elbow to press the sidewalk button? Can I lay on the field for some fresh air? Can dogs play together? The “rules” seem to change regularly since there is still so much to learn about the virus.
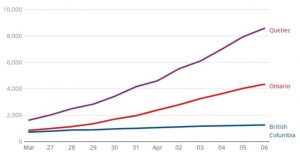
Take a look at the line chart below
It is no doubt that these are trying times and a widespread effort is key. However, our hard work in BC is paying off — we are beginning to flatten the curve! This means there is a general decrease in the number of new COVID-19 cases everyday. On the left, vertical side of the chart– called the Y-axis, it shows the number of active cases (though it doesn’t actually say in this chart, it assumes the viewer already knows — I think it is still important to indicate what the vertical numbers represent). The bottom, horizontal side — called the X-axis, represents time in days. They indicate the days clearly from March 27-April 6. As you can see, BC (blue) has a straighter line than Quebec and Ontario. This means that there are fewer new cases of COVID-19 in BC everyday than there are in Ontario and Quebec. BC’s line is flatter.
Source: CBC (April 6, 2020)
Click photo for news article
1. Morning Journal
What could be some reasons that BC’s curve is “flatter” than Ontario and Quebec?
Please comment on this post with your thoughts.
According to my understanding (thanks to the media), the answer is not clear but there are many theories.
Some information we know that could be meaningful in your inferences:
– Quebec had their spring break a week before BC and Ontario — the social-distancing requirements were implemented in the middle/end of their spring break.
– The population density (how many people living in a given area) is greatest in Ontario. Quebec and BC are comparable, though Quebec is still more “crowded” than BC.
– BC has a milder climate than Ontario and Quebec
2. Survey
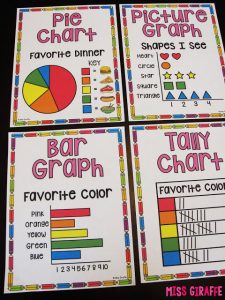
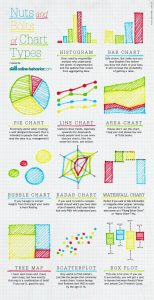
There different ways to display information. Information is also called data. As we saw above, a line chart is one way to represent collected data. we have briefly practiced with surveying in class. Please create a survey and represent in the way you wish. Examples include a pie chart, pictograph, bar graph or tally chart. If you wish to challenge yourself, take a look at more complex ways of representing data (second picture). Ignore the description below the picture and title of each chart.
https://www.surveymonkey.com/r/BLJ68VV
For this assignment:
1. Ask questions that you truly curious about. Be sure most people can relate and have an answer to it.
2. Limit responses to a maximum of 5. Avoid create an “other” response option.3. Ask as many people as possible to get a more accurate display of trends (collection of data). You may need phone friends/family to collect more data. The people you collect data from in your survey are referred to as your population.
3. Khan Academy
Continue your daily practice. I encourage at least 30 mins per day. I notice a lot of you created usernames that don’t give any hint to who you may be. If you are not using your name, please let me know what your username is so I can properly track your progress.
4. Reading
Continue your independent reading. I encourage you to keep track of any connections, visualizations, questions and/or inferences that you stumble upon. Keep track of any vocabulary words that you would like to know the definition of and look it up in the dictionary. (I still do this! It’s a great way to build your vocabulary and better express yourself through words).
5. Service
30 mins of a helpful chore around the house.
6. Body Break
Get your body moving and your heart rate up.
7. Social Break
During this time, it is important to stay in touch with friends and family. If possible, connect with someone through a video chat. This will be a good opportunity to ask questions for your survey, too. Otherwise, a phone call or messaging (such as in the Teams chat) will be helpful too.


Very thorough schedule Ms. D!
Great work Ms. Daneshwand! You have put so much thought and effort for your students and I know they appreciate you for it!
Thank you so much for Arranging the schedule Ms.Daneshwand .
That’s really helpful to keep the kids on schedule.
Thanks for the assignments Ms. Daneshwand!
Hi everyone – Suncrest teachers and Division 7! 😊 We miss you.
Piper + Leanne
Hi
hi
This is what i think(for morning journal) maybe the reason BC’s curve is flatter because everyone is staying inside and and there is barley anyone outside but the people that are outside are far more the 6 feet away.
Hi I like what we’re doing you have put a lot of work into it it’s great
My mom and I watched CBC news for Covid 19. It said that BC told nurses that they could not work at more than one hospital.They said that because if a patient had Covid19 then they could give a nurse covid. If that nurse went to another hospital, that nurse could give more people Covid19. covid stands for crown in spanish launguage.It is called crown because it’s shaped as a crown.
BC’s curve is flatter then Ontario and Quebec because we stay at home more and less people are getting sick. If people go out more then this Covid-19 will not stop.I think that people are staying at home more because they don’t want to get sick, and only going out for important things.
BC’s curve is flatter than Ontario and Quebec because we stay at home more and less people are getting sick. If people go out more then this Corvid-19 will not stop. I think people in BC are staying at home more because they don’t want to get sick, and only going out for more important things.
why the curb is flatter
our curb is flatter because our spring break is after Quebec and Ontario. When it was our spring break they said there was going to be a lockdown. When it was Quebec spring break so everybody went around and got covid 19. After Quebec got so bad that they started taking about Quebec on the news so then not a-lot of people went away in Ontario so Ontarios curb was flatter then Quebec and bc was even curb.
I think BC is getting better because we are trying to social distancing.
I think that since our Spring Break was later, so we had some notice that Covid 19 made it unsafe to go anywhere. I think people maybe are not social distancing sometimes, so we they have to be careful about that. Maybe more people can catch it.
I think the reason that we are flatter is because were staying home mostly, and we are going outside for things we need and stay away from stranger’s for about five feet apart.
Mateu says:
I think the curve is flatter in BC because in Ontario and Quebec they are not following the social distancing rule and Quebec and Ontario have more people so there will be more hosts for the corona virus.
I think B.C.’s curb is more flat then Ontario and Quebec because people are social distancing, staying home and only leaving their homes to get groceries and take walks.
I did a survey on favorite colours and made a bar graph.
1. I wonder if hospitalization are covid related
2. Maybe more people are staying at home in BC.
3. Maybe BC follows quarantine rules more strictly
4. I wonder if BC has less of covid 19 cases because not all are reported
5. Maybe BC has better health care
6. Maybe BC people isolated sooner
7. Maybe Ontario and Quebec had more people travelling
I think that less people dont have the virus in BC and more people in Ontario and Quebec has the virus because BC has less population. I think BC has taken the virus more seriously.
I think that B.C.’s curve is flatter because everybody is staying inside.