So back to marching and playing an instrument. Here is a website I found that was very useful and explained why math was needed while marching and playing an instrument at the same time.https://prezi.com/occ1nwoucfda/how-are-math-and-marching-band-related/
Tag Archives: Math
Module Two Post Three (A guide to using Filmora video editer)
I have decided to use Filmora to edit my year end project. In this website it explains what Filmora is and how to edit using it. The video editor can do the same things as iMovie but they have different effects, transitions and more. Using this website will help me while I am making the video so I can make it look more appealing.
https://filmora.wondershare.com/guide/editing-video.html
Module Two Post Five
Here is a video about making graphs using Excel.
Module Two Post Four
After talking about various graphs, you might ask “What is a graph?”. It is a diagram that exhibits a relationship, often functional, between two sets o f numbers as a set of points having coordinates determined by the relationship. A pictorial device, such as a pie chart or bar graph, used to illustrate quantitative relationships. Two-dimensional drawing showing a relationship (usually between two set of numbers) by means of a line, curve, a series of bars, or other symbols. Typically, an independent variable is represented on the horizontal line (X- axis) and an dependent variable on the vertical line (Y-axis). The perpendicular axis intersect at a point called origin, and are calibrated in the units of the quantities represented. Though a graph usually has four quadrants representing the positive and negative values of the variables. A graph is a visual way to display information.
To make a graph, people often use a paper like this:

Now, you know what is a graph.
Module Two Post Two (iMovie ZOOM Transition)
In this Youtube video it shows you how to do a ZOOM transition which is one of the transitions I’m thinking of using in my end of year presentation. It shows you exactly how to do it with steps and it’s very clear.
Module Two Post Three
There’s another way to make graphs, and fashion designers use them very often — Pie chart. They are simple to make and simple to understand, a pie chart is a popular form of data comparison, consisting of a circle that is split into parts.

Module Two Post One (iMovie (2013): Trim, split, and move clips)
In this website it teaches you how to edit a clip of a video and how to combine it with other video clips. How to extend clips, shorten clips, speed up clips and lengthen the duration of clips. You can also trim off a bit of a clip if you don’t want a part to be apart of your finished film. You can add in effects, colour, and cool transitions!
Module Two Post Two
Fashion designers use various ways to analyze data, for example, bar graph, they are pleasing to the eyes. Bar graphs compare data in a simple format consisting of rectangular bars. With a few varieties to choose from, settling on the right bar graph might be confusing.

Module One Post Eight
Marching and playing an instrument is a difficult thing to do. It requires lots of concentration and patience. In air cadets you go through lots of drill and you need to know angles for it. Sometimes the commands would call for a 45 degree and and sometimes a 180 degree angle. There are also salutes in cadets and they also have to be in an angle so there is even angles and math involved in marching and drill. Here is a video clip of the drill team
Module Two Post One
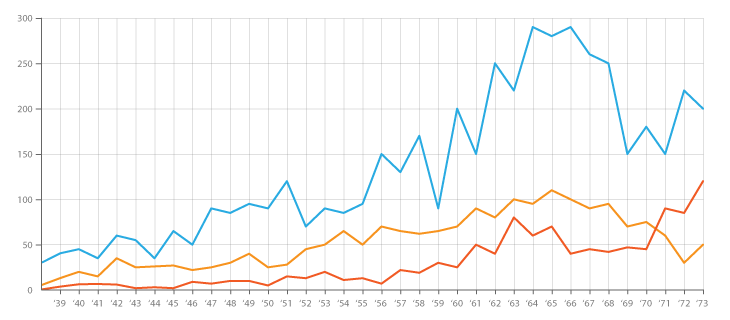
Fashion designers make graphs to analyze data. And line graph is a good choice, also it is related to math too. Comparing various sets of data can be complicated, but line graphs make it easy. The plotted peaks and dips on the grid allow you to monitor and compare improvement and decline. Line graphs are most often used by professionals and students.

