Here is a video about making graphs using Excel.
Tag Archives: fashion design
Module Two Post Four
After talking about various graphs, you might ask “What is a graph?”. It is a diagram that exhibits a relationship, often functional, between two sets o f numbers as a set of points having coordinates determined by the relationship. A pictorial device, such as a pie chart or bar graph, used to illustrate quantitative relationships. Two-dimensional drawing showing a relationship (usually between two set of numbers) by means of a line, curve, a series of bars, or other symbols. Typically, an independent variable is represented on the horizontal line (X- axis) and an dependent variable on the vertical line (Y-axis). The perpendicular axis intersect at a point called origin, and are calibrated in the units of the quantities represented. Though a graph usually has four quadrants representing the positive and negative values of the variables. A graph is a visual way to display information.
To make a graph, people often use a paper like this:

Now, you know what is a graph.
Module Two Post Three
There’s another way to make graphs, and fashion designers use them very often — Pie chart. They are simple to make and simple to understand, a pie chart is a popular form of data comparison, consisting of a circle that is split into parts.

Module Two Post Two
Fashion designers use various ways to analyze data, for example, bar graph, they are pleasing to the eyes. Bar graphs compare data in a simple format consisting of rectangular bars. With a few varieties to choose from, settling on the right bar graph might be confusing.

Module Two Post One
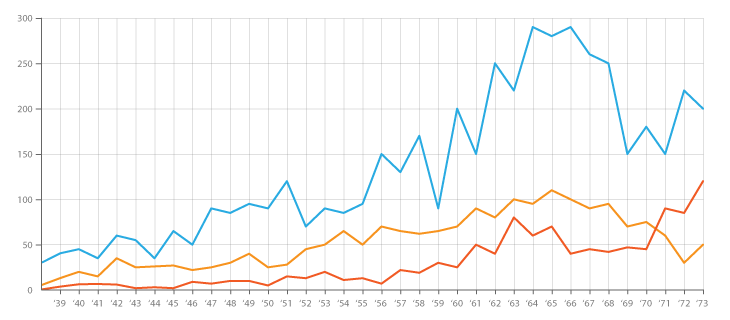
Fashion designers make graphs to analyze data. And line graph is a good choice, also it is related to math too. Comparing various sets of data can be complicated, but line graphs make it easy. The plotted peaks and dips on the grid allow you to monitor and compare improvement and decline. Line graphs are most often used by professionals and students.

Module One Post Fifteen
Since it’s the last post for module one, I will be telling you 5 fun facts about fashion design.
1. The first fashion magazine was published in Germany in 1586.
2. Evidence for the first clothes dates somewhere between 100,000 to 500,000 years ago.
3. Men’s shirts button on the right, and women’s on the left.
4. The four major fashion capitals of the world are New York, London, Milan, and Paris. Each city holds fashion shows twice, in February and September.
5. The five most common clothing materials are linen, cotton, polyester, and rayon. Cotton is the most widely used clothing material, but it only became common in mid 1800 s, when Eli Whitney’s cotton gin made it easy to separate the cotton fibers from the seeds.
Module One Post Fourteen
What is textile math?
The mathematics in textile is known as textile mathematics. The ideas have been used as inspiration for a number of fiber arts including quilting, knitting, cross-stitch, crocheting, embroidery and weaving and spinning. A wide range of mathematical concepts have been used for it. Some techniques such as counted-thread embroidery are naturally geometrical,. Other kinds of textile has a meaning for the colorful physical expression in mathematical concepts. In textile, spinning, weaving, knitting, embroidery and fashion designing is done with the help of textile mathematics.

Module One Post Thirteen
In order to understand the 3-D design better, here’s a video about how to draw a 3-D drawing.
You can try it yourself!
Module One Post Twelve
Some fashion designers use computer to design their clothes, and computer has a big connection with math.
Here’s a video link about how computers do math.
Module One Post Eleven
The human eye is able to decipher patterns of light according to the primary colours: red, green and blue. However, there are other colours too: cyan, magenta and yellow. So, colour and math are related, you can do addition and subtraction with colours too. Further, there’s endless combo you can do with colours.

