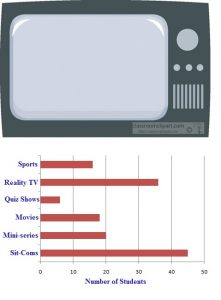
Create a bar graph using the blank document provided or create your own. Make bars reaching up to the number of hours you’ve spent looking at each type of screen. Then, add all of the hours together and type that answer in the comments. Do this for today. For an extra challenge, keep a log for 7 days.
* 30-minute increments can be shown by ending the bar between two numbers. *TV: cable, streaming networks, movies![]()