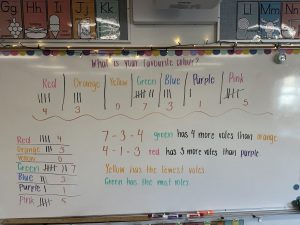
We’ve been learning about different types of graphs and how we can interpret the data we receive, through making comparisons and observing patterns. We have started to do a survey a day, and here is the one we talked about today! Here, we did a survey about our favourite colours and recorded this in a tally chart, formatted in two different ways.