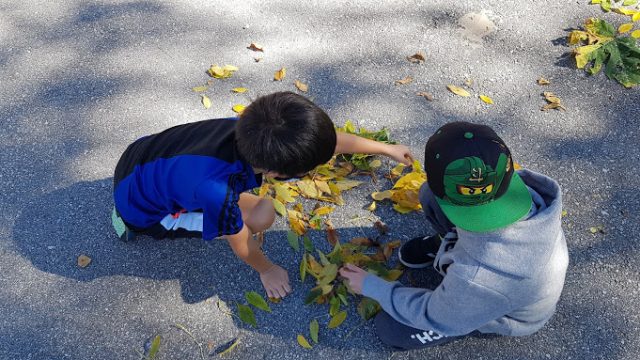
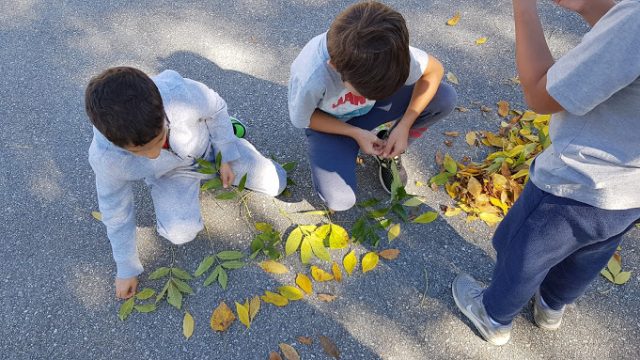
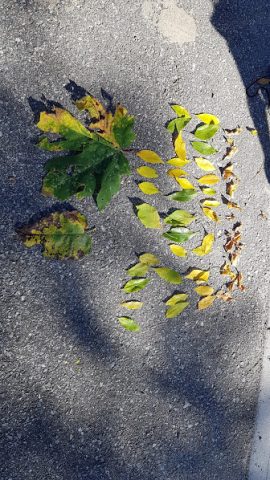
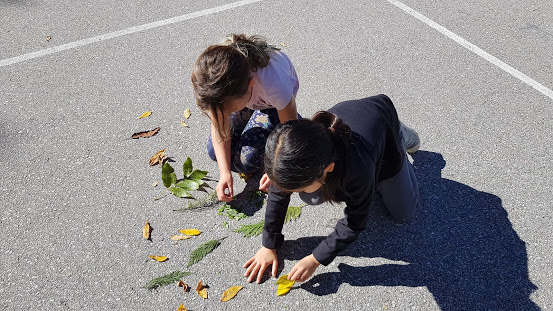
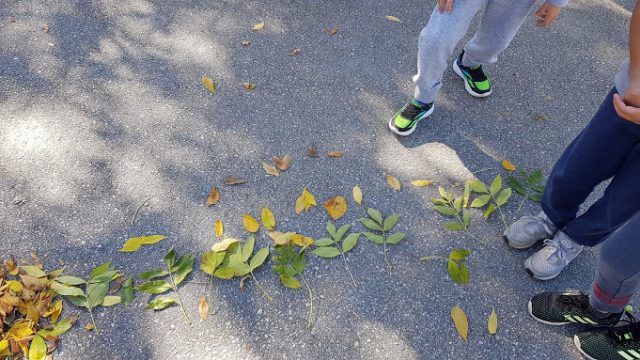
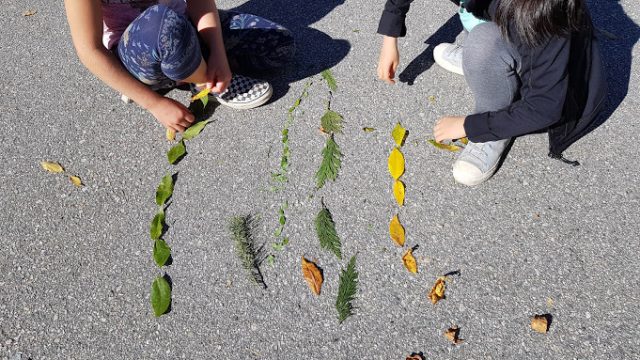
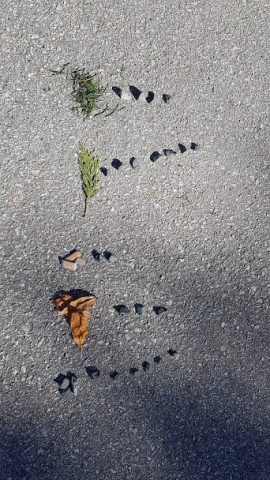
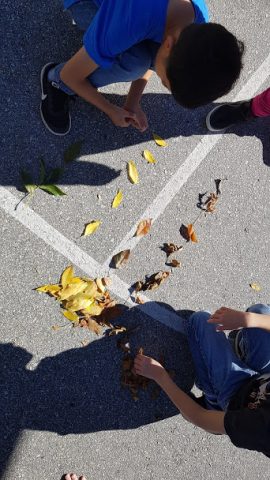
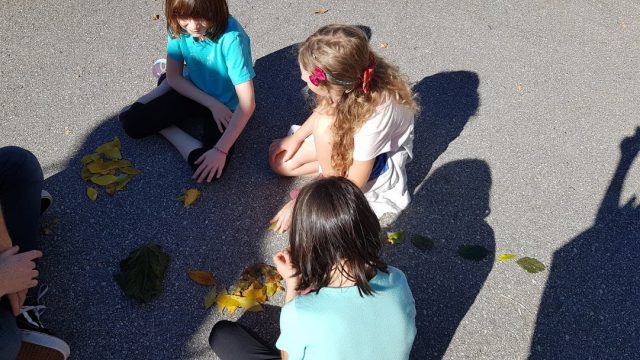
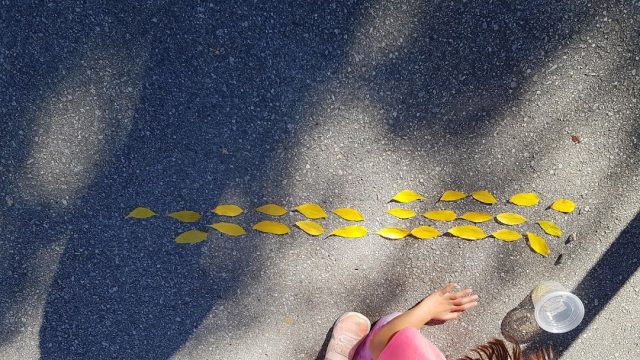
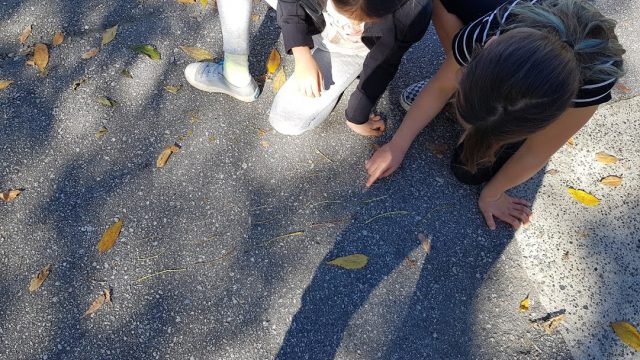
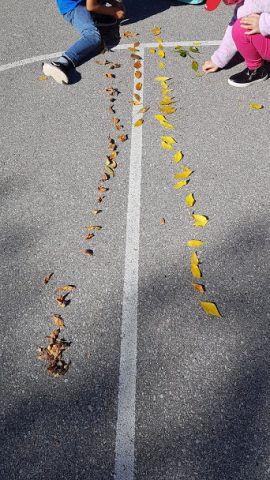
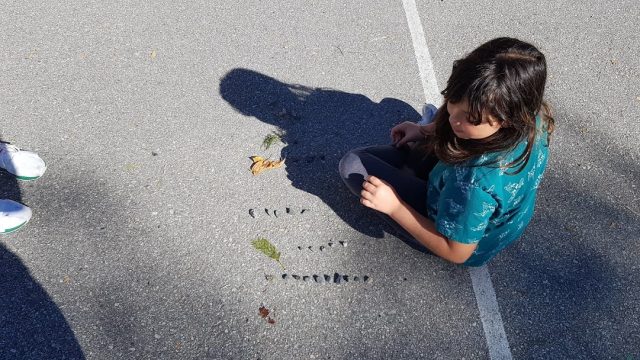
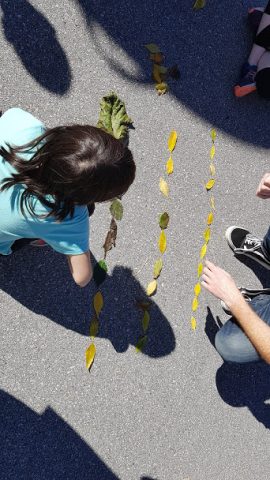
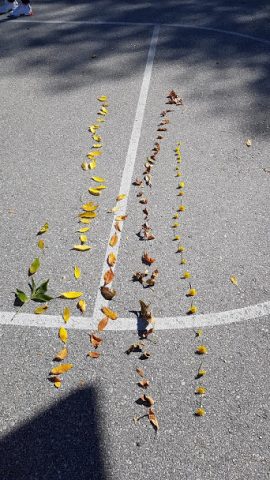
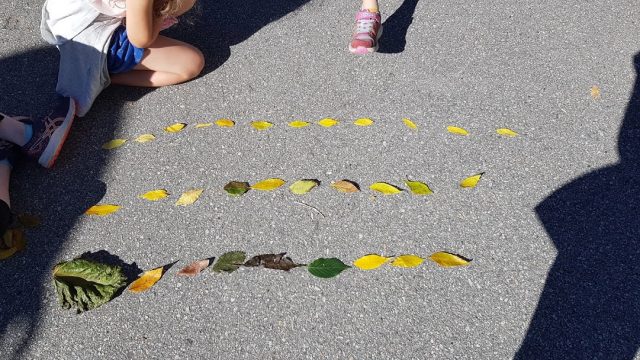
Div. 6 has been busy getting to know one another during the last few weeks. By creating questions and gathering data, we have explored tallies, bar graphs, and pictographs. We have also graphed our observations outside. What characteristics can we use to group our found materials? How can we organize our data to compare and analyze what we have found? Which ways of representing help us easily recognize the differences between amounts?
Leave a Reply